Portland has a strong transit system overall, yet service is not evenly distributed. Some neighborhoods with the highest dependence on public transit still fall outside the walking-distance service area of any bus stop.
This tool quantifies that mismatch and outputs the specific street segments where the gap is worst, so planners can target investment.
Built as a reusable, parameterized geoprocessing tool — the same workflow can be re-run for any city.
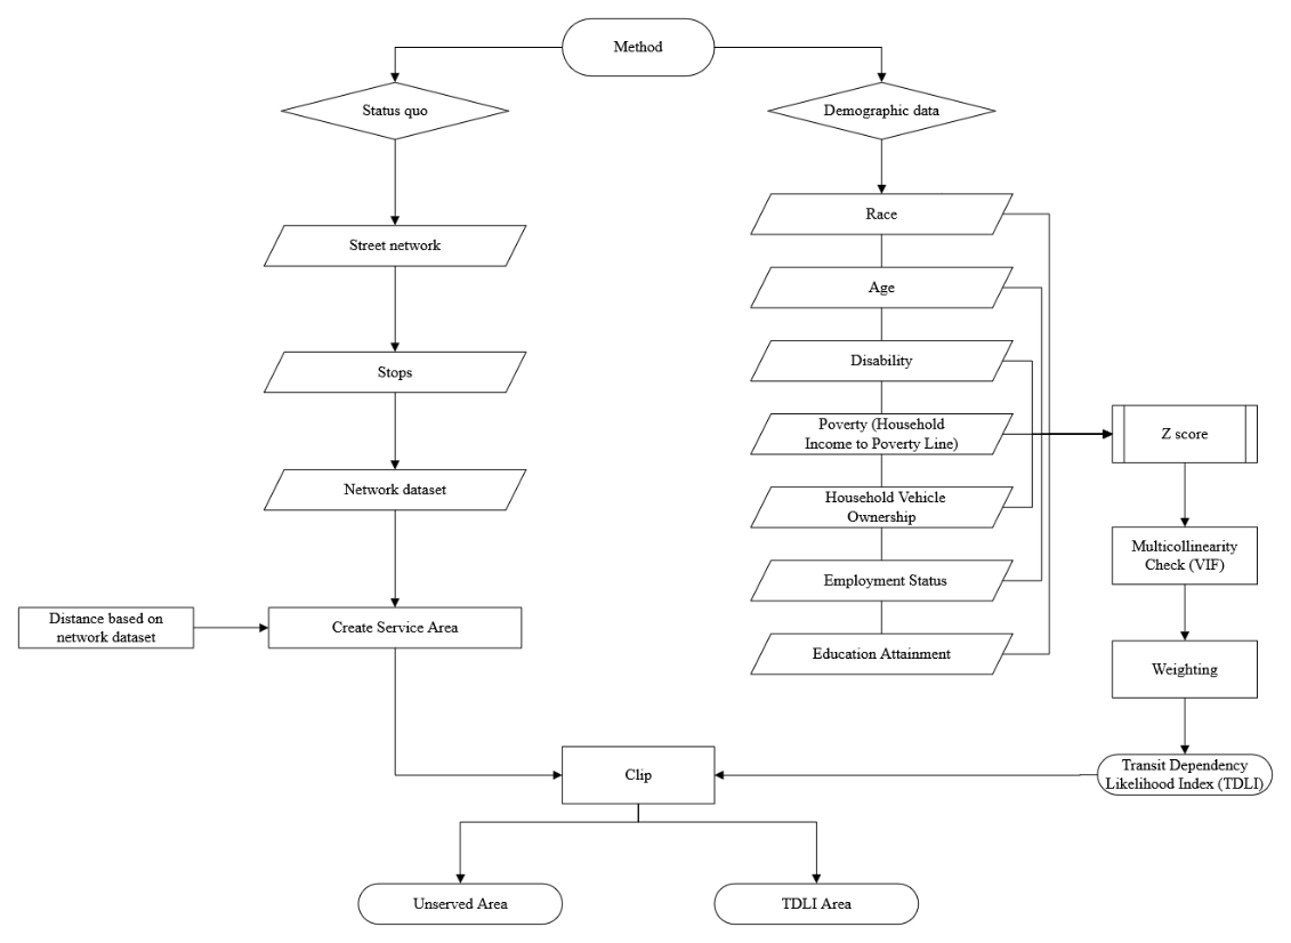
- Read a polygon layer and user-selected demographic fields with ArcPy.
- Standardize each variable with z-scores, reclassify into weighted scores.
- Compute a weighted Transit Dependency Index per polygon.
- Run a multicollinearity (VIF) check on the variables.
- Build Network Analyst service areas around bus stops at a walking-distance threshold.
- Use symmetric difference + clip to isolate high-need areas outside coverage and output the unserved streets.
PORTLAND RUN · SETTINGS
| Parameter | Value |
|---|---|
| Variables | age 65+, poverty, minority, disability, vehicle access, education |
| Weighting | Equal |
| Service distance | 800 ft around active stops |
| High-need threshold | TDI ≥ 0.5 |
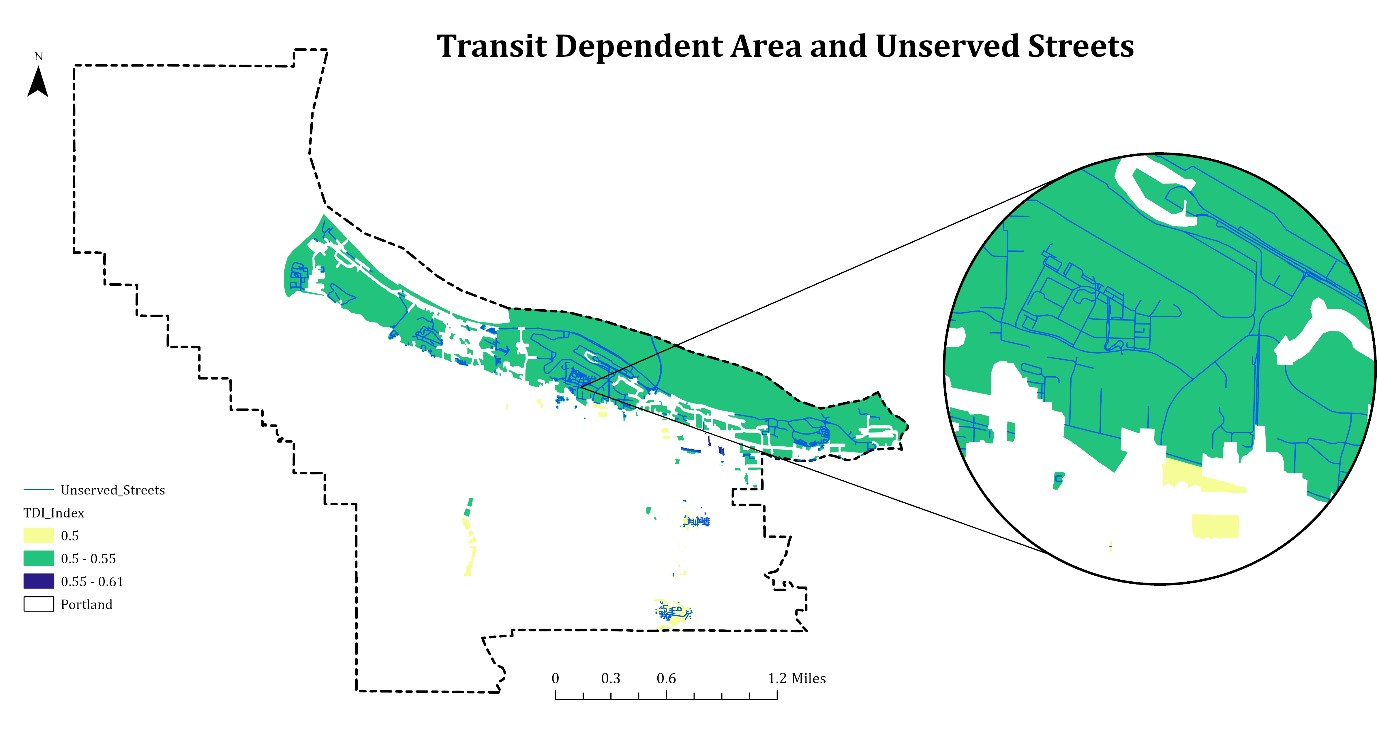
High transit-dependency areas concentrate in the northern part of the city, and many fall outside the 800-ft service area of existing stops — a clear, mappable service gap. The demographic profile of those zones confirms the index is capturing genuine vulnerability.
The output unserved-street layer gives planners a direct, actionable target for new stops, routing changes, or micro-transit.
- Single accessibility radius for all transit modes (next: mode-specific radii).
- Ignores service frequency and reliability (next: schedule-based weighting).
- Add data-quality and CRS checks; package as a
.pytPython toolbox.
Read the code
Full ArcPy tool, toolbox, README, and maps on GitHub.