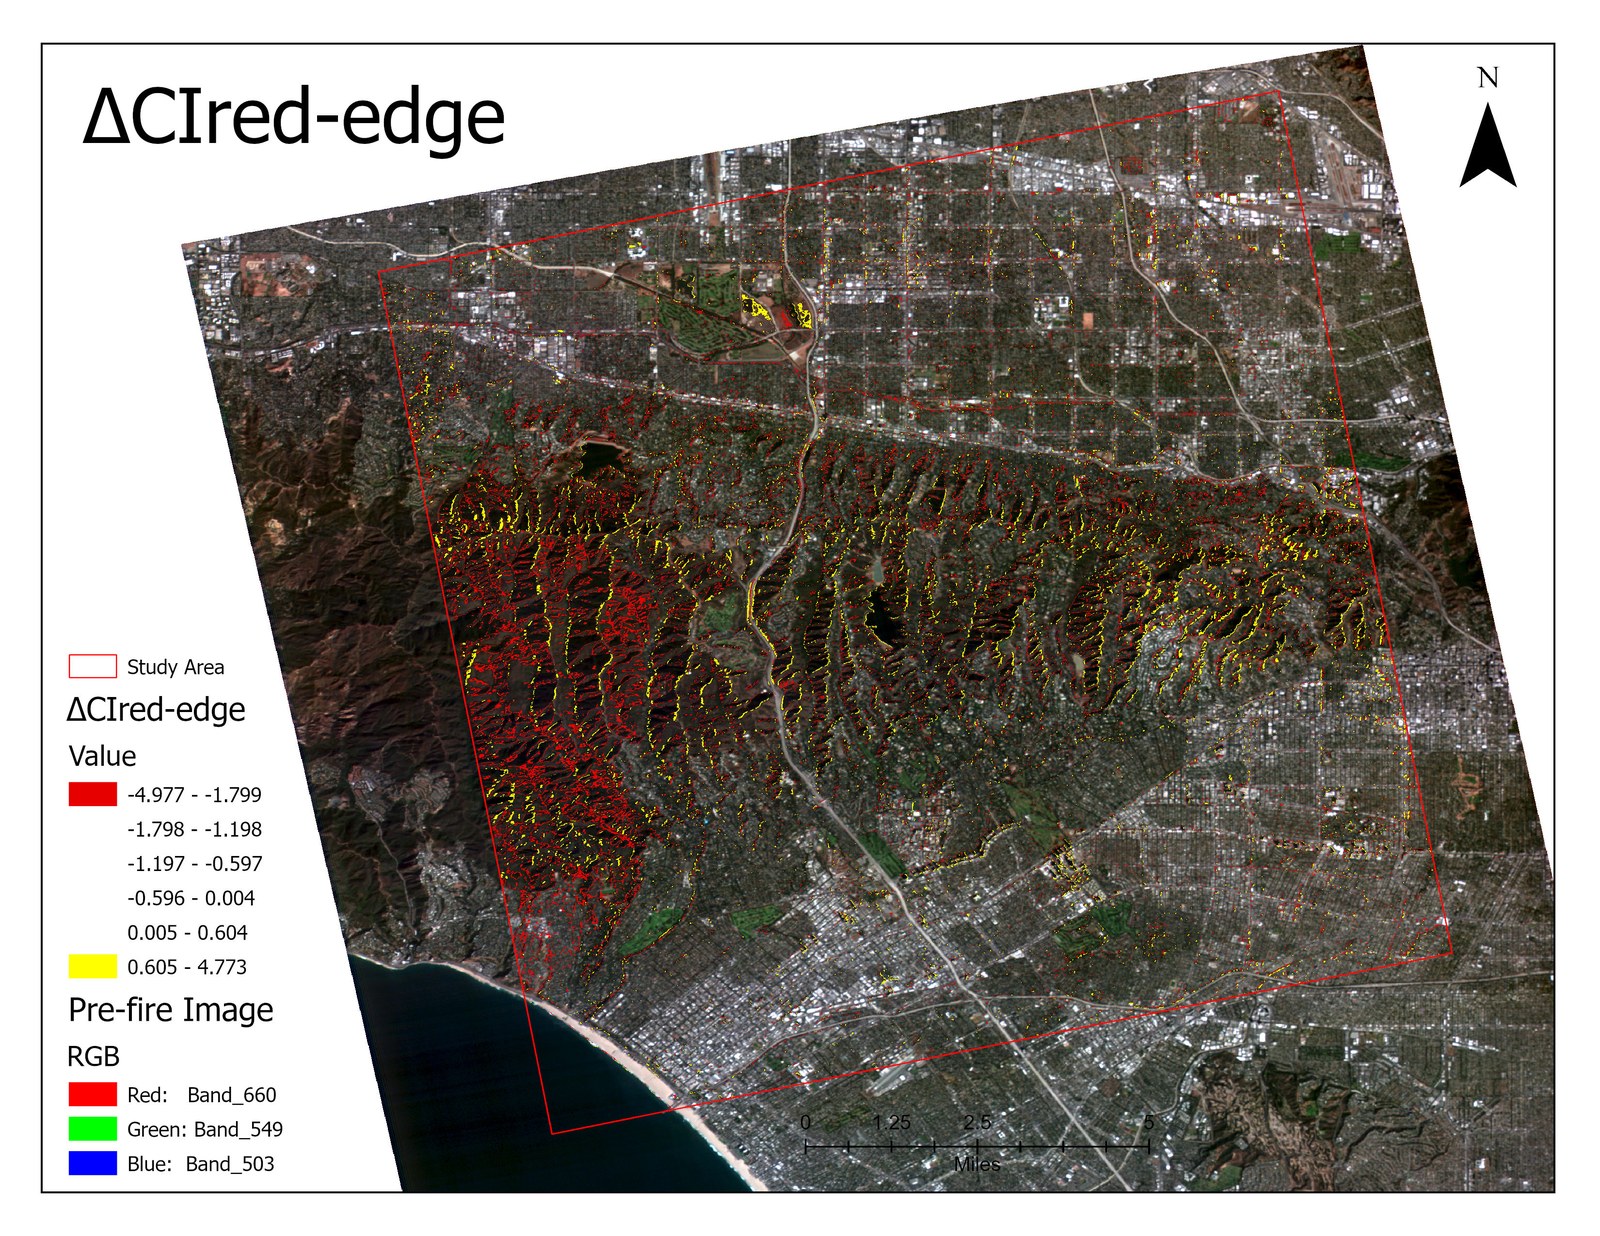
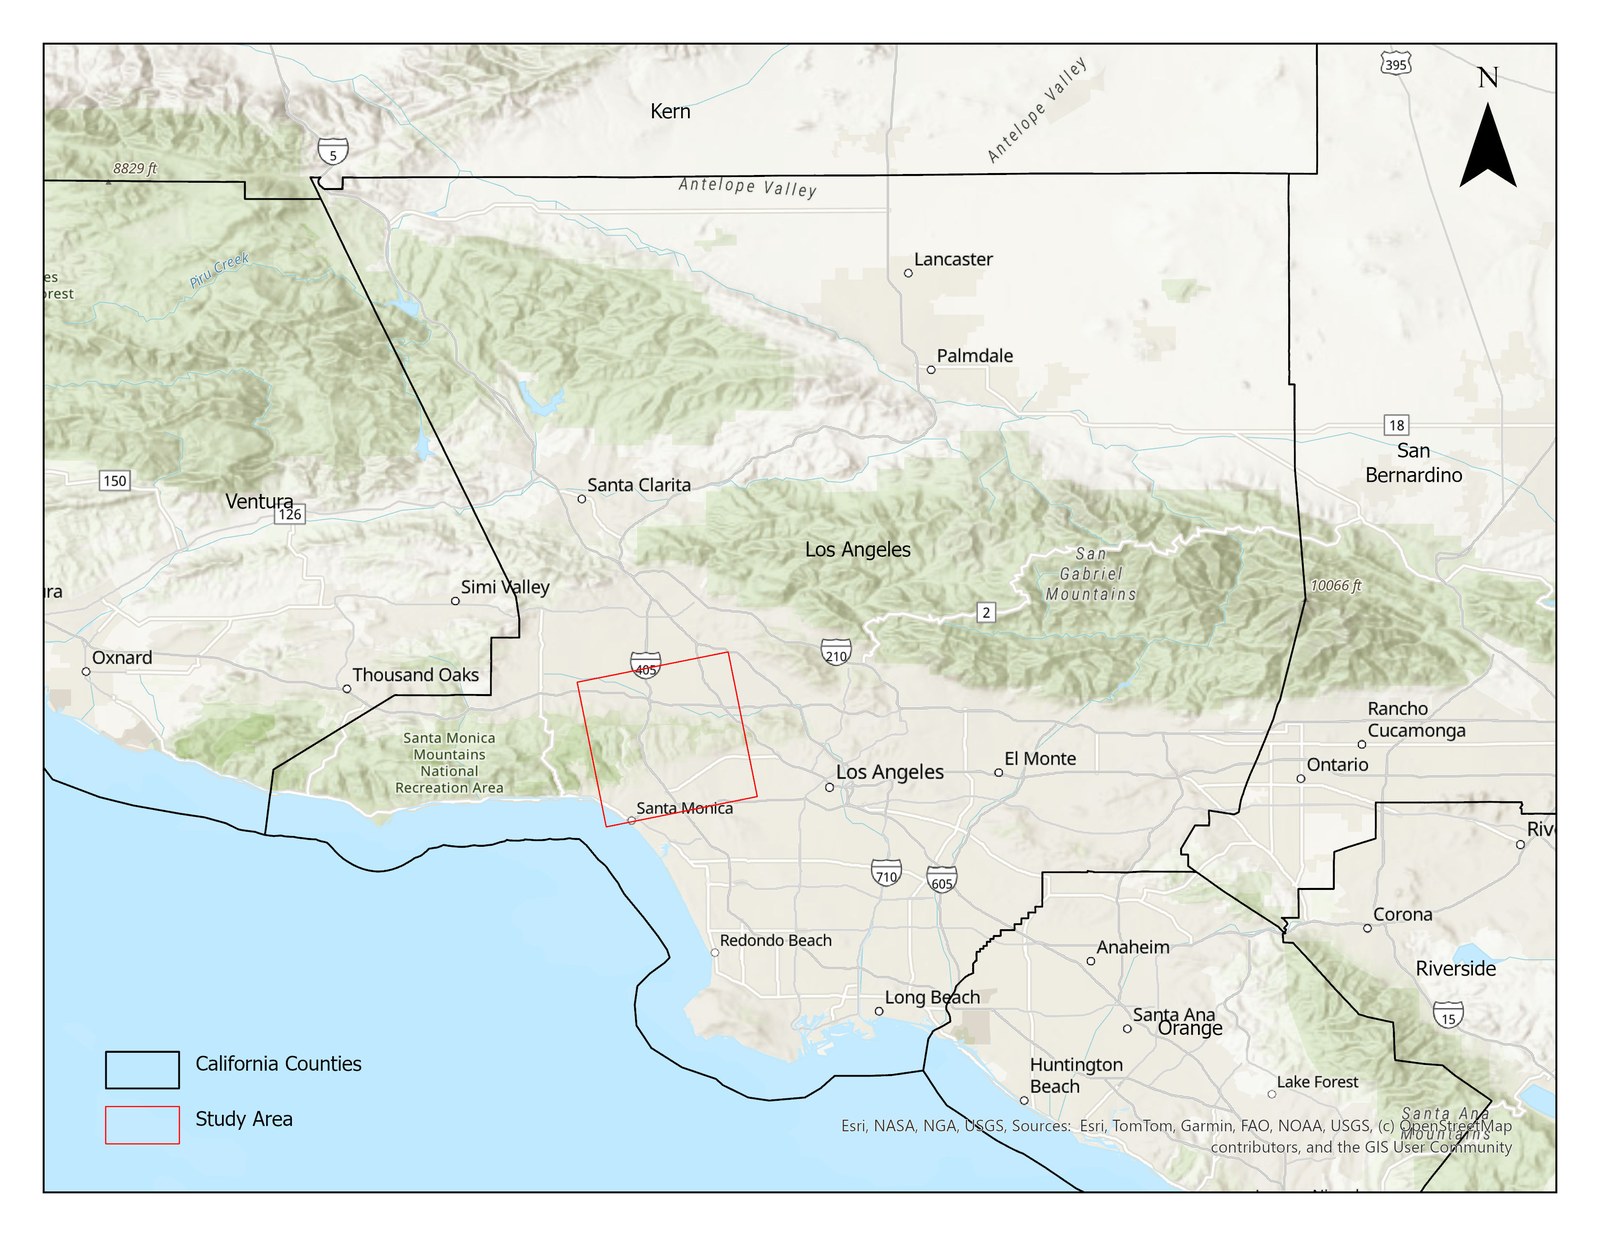
The Palisades Fire hit a coastal chaparral wildland–urban interface of steep terrain, damaging vegetation and infrastructure across Los Angeles County.
Maps of where vegetation was lost and how severe the burn was feed burn-severity assessment, recovery monitoring, and fire-risk planning.
Index-based change detection turns two satellite images into a quantitative map of vegetation damage.
Commercial VNIR hyperspectral imagery from the Wyvern Dragonette-001 satellite. I chose it for the narrow red-edge bands, which are highly sensitive to vegetation stress.
- Resolution: 5.3 m, 23 bands (500–800 nm), 12-bit
- Pre-fire: 04 Nov 2024 · Post-fire: 23 Jan 2025
- Bands used: red-edge (b20, ~750 nm) and NIR (b23, ~799 nm)
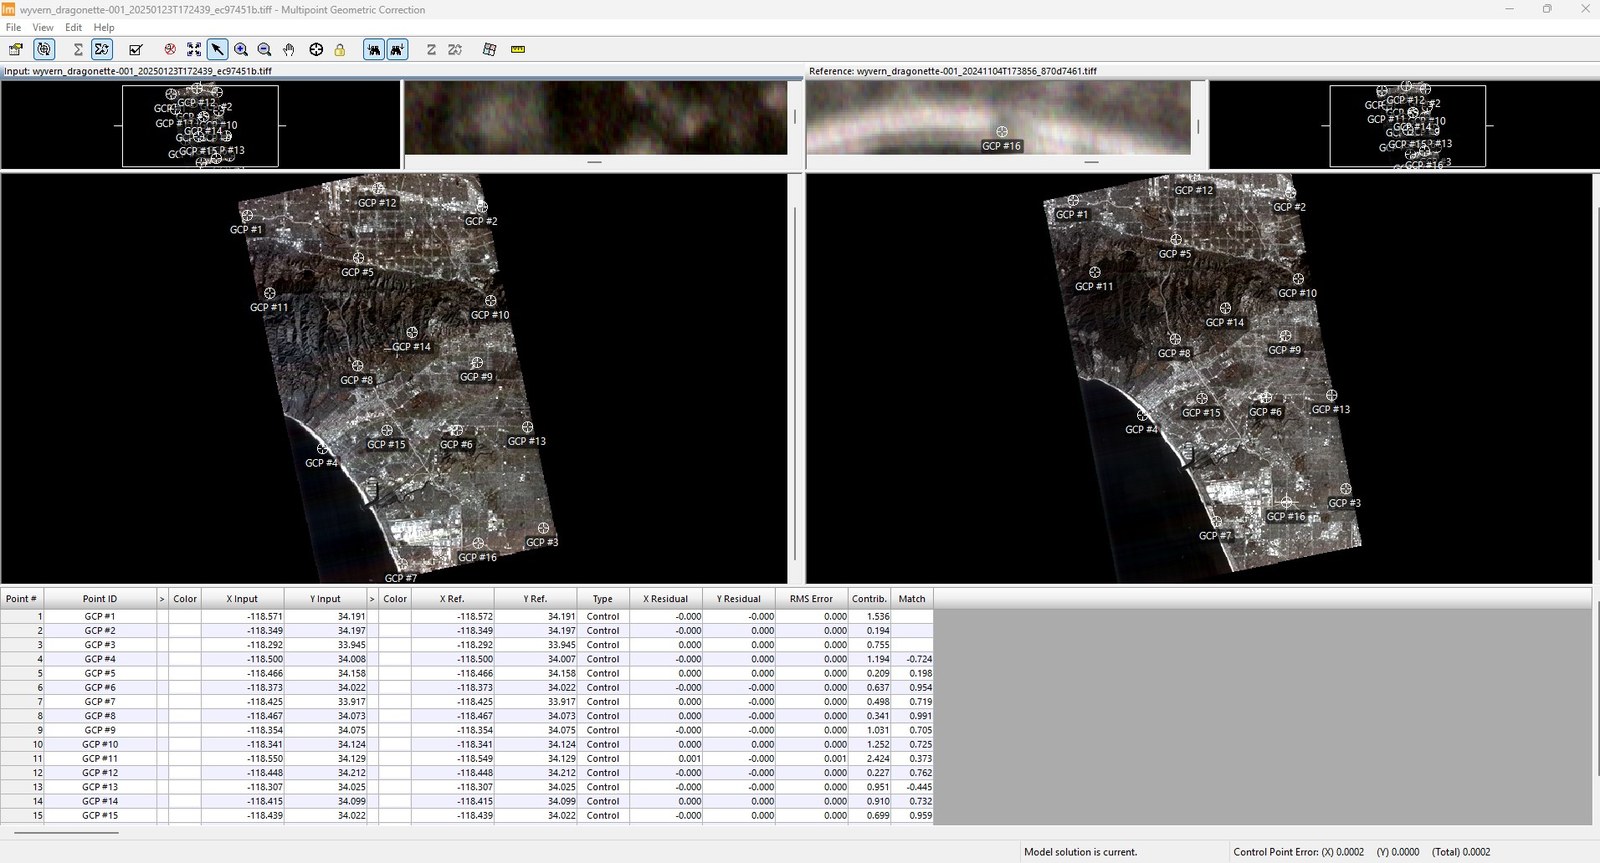
- Visual co-registration check and multipoint geometric correction (total RMS 0.0002).
- Select red-edge (b20) and NIR (b23) bands from the hyperspectral cube.
- Convert radiance to TOA reflectance using image metadata.
- Stack bands and re-project WGS84 → WGS 1984 UTM Zone 11N.
- Compute CIred-edge and NDVIred-edge for both dates.
- Difference (post − pre) to build change maps; negative Δ = vegetation loss.
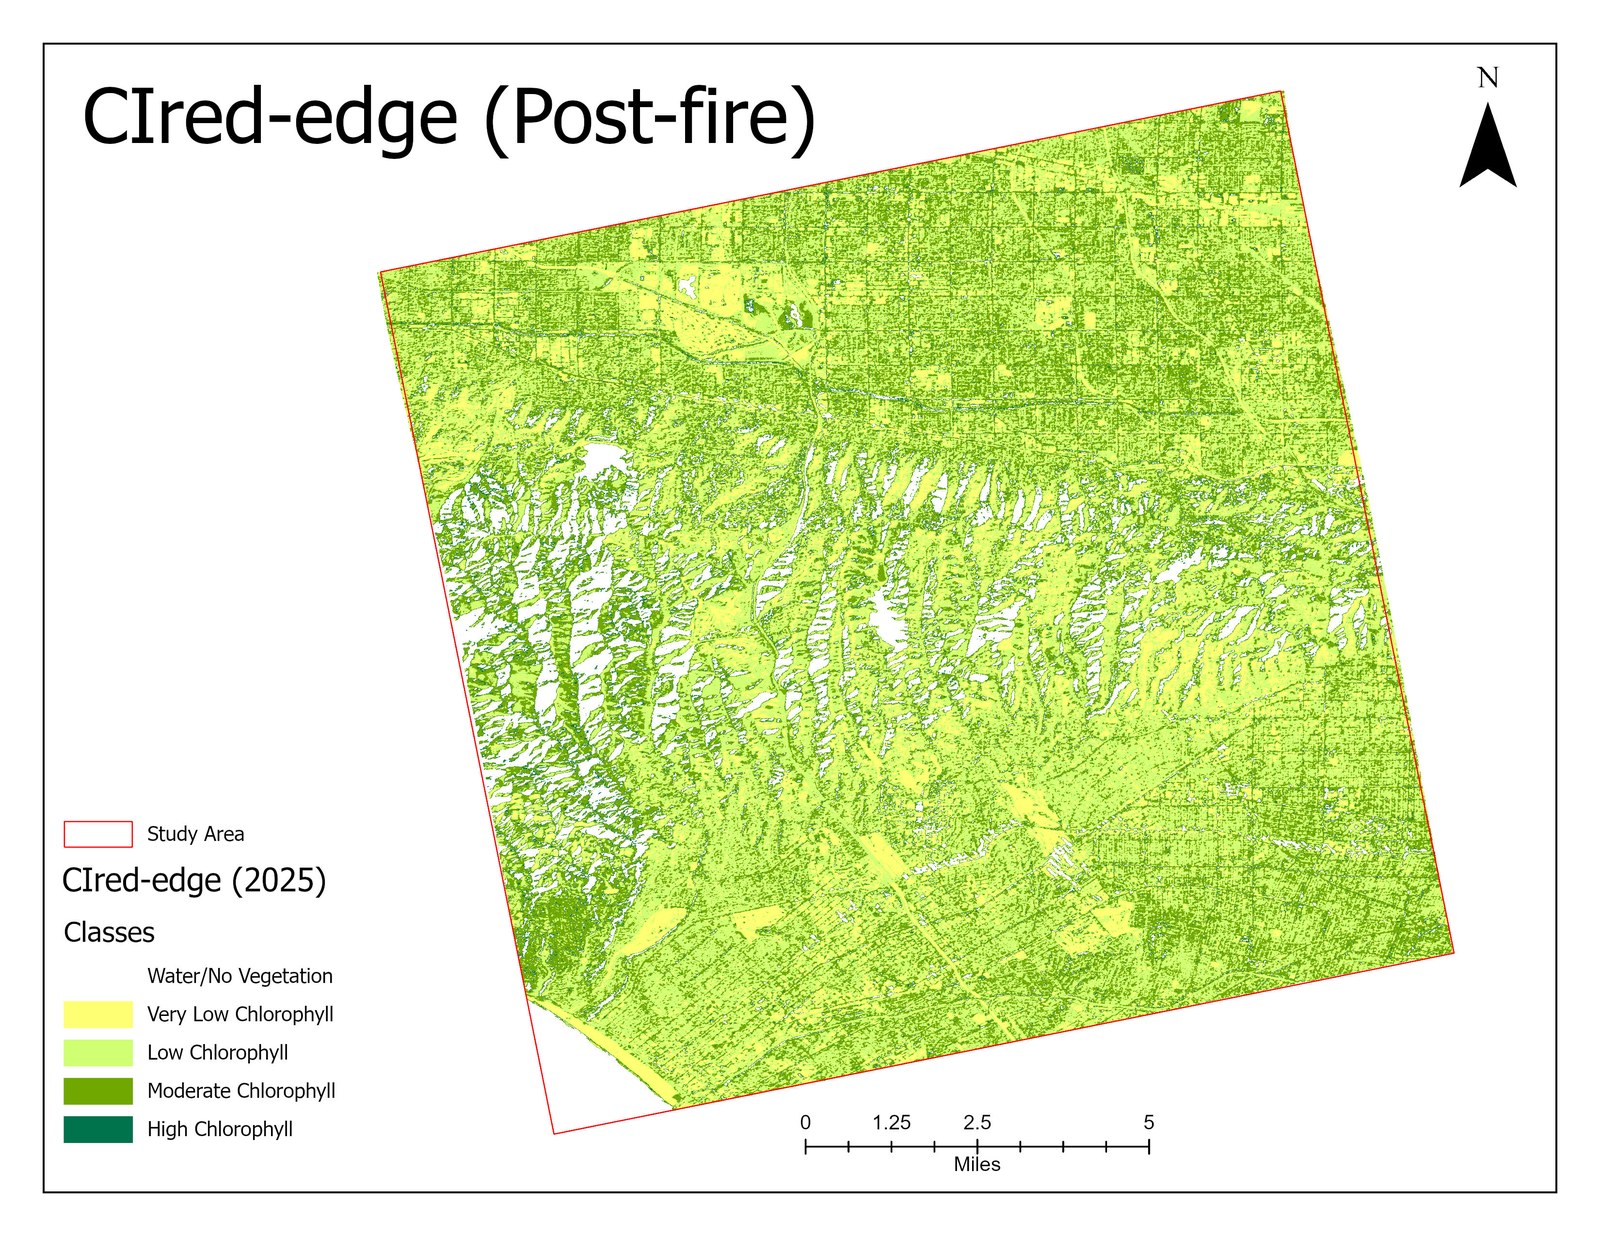
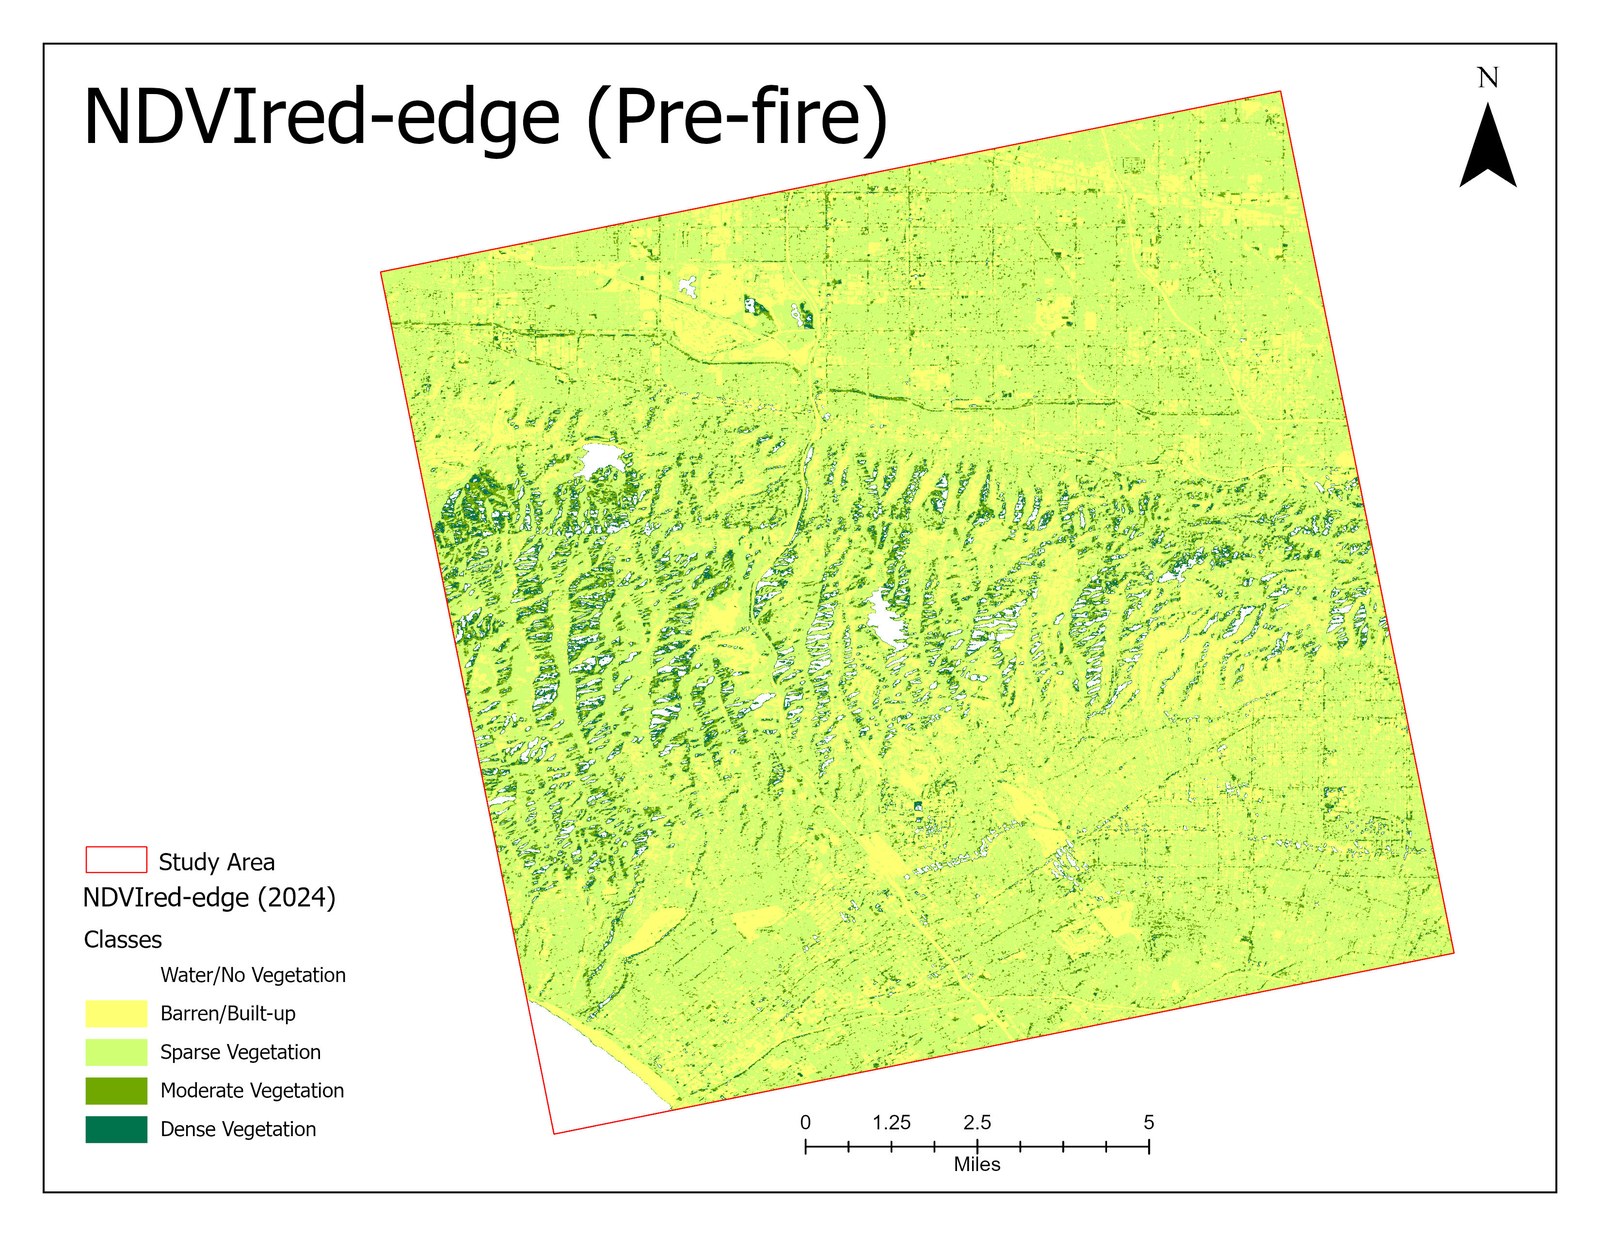
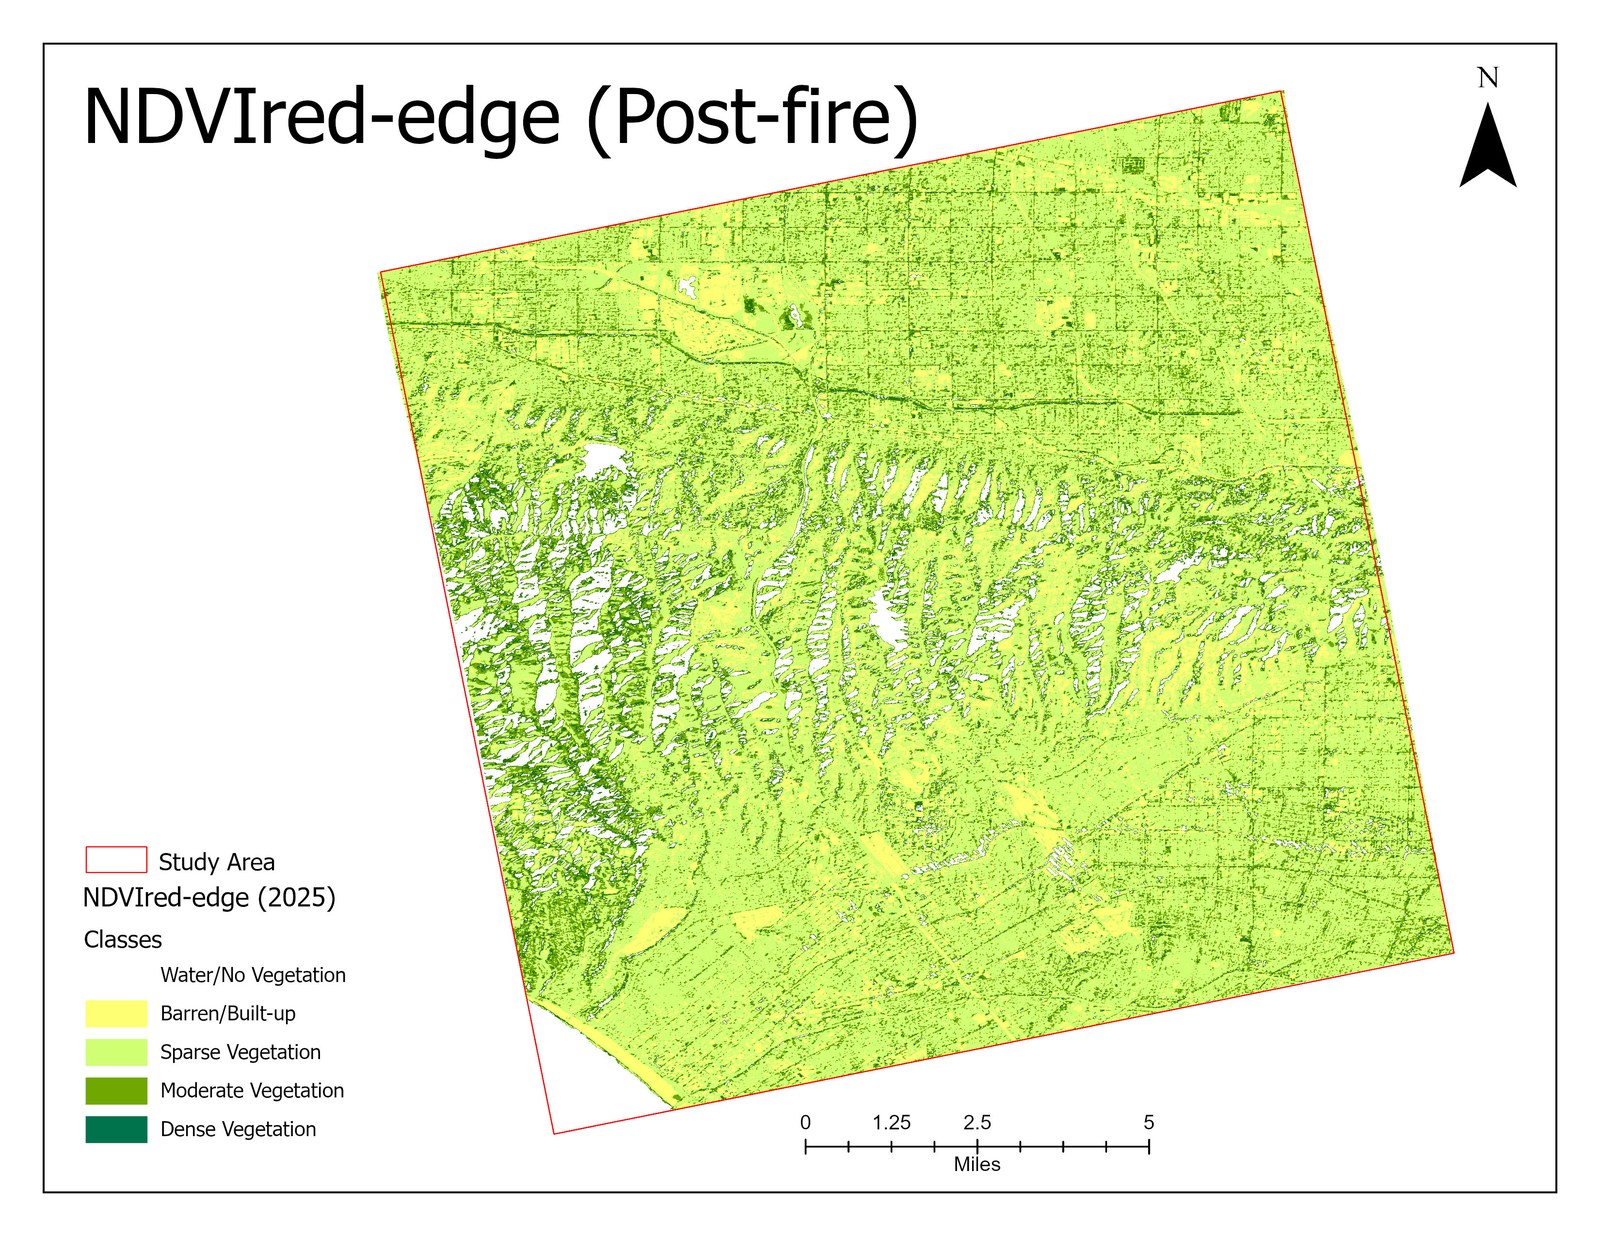
Vegetation loss concentrated in forested hilltops with high burn severity, while urban and built-up areas showed little change. Both indices agreed spatially: CIred-edge captured chlorophyll loss and NDVIred-edge captured structural canopy loss.
CIRED-EDGE · PRE VS POST
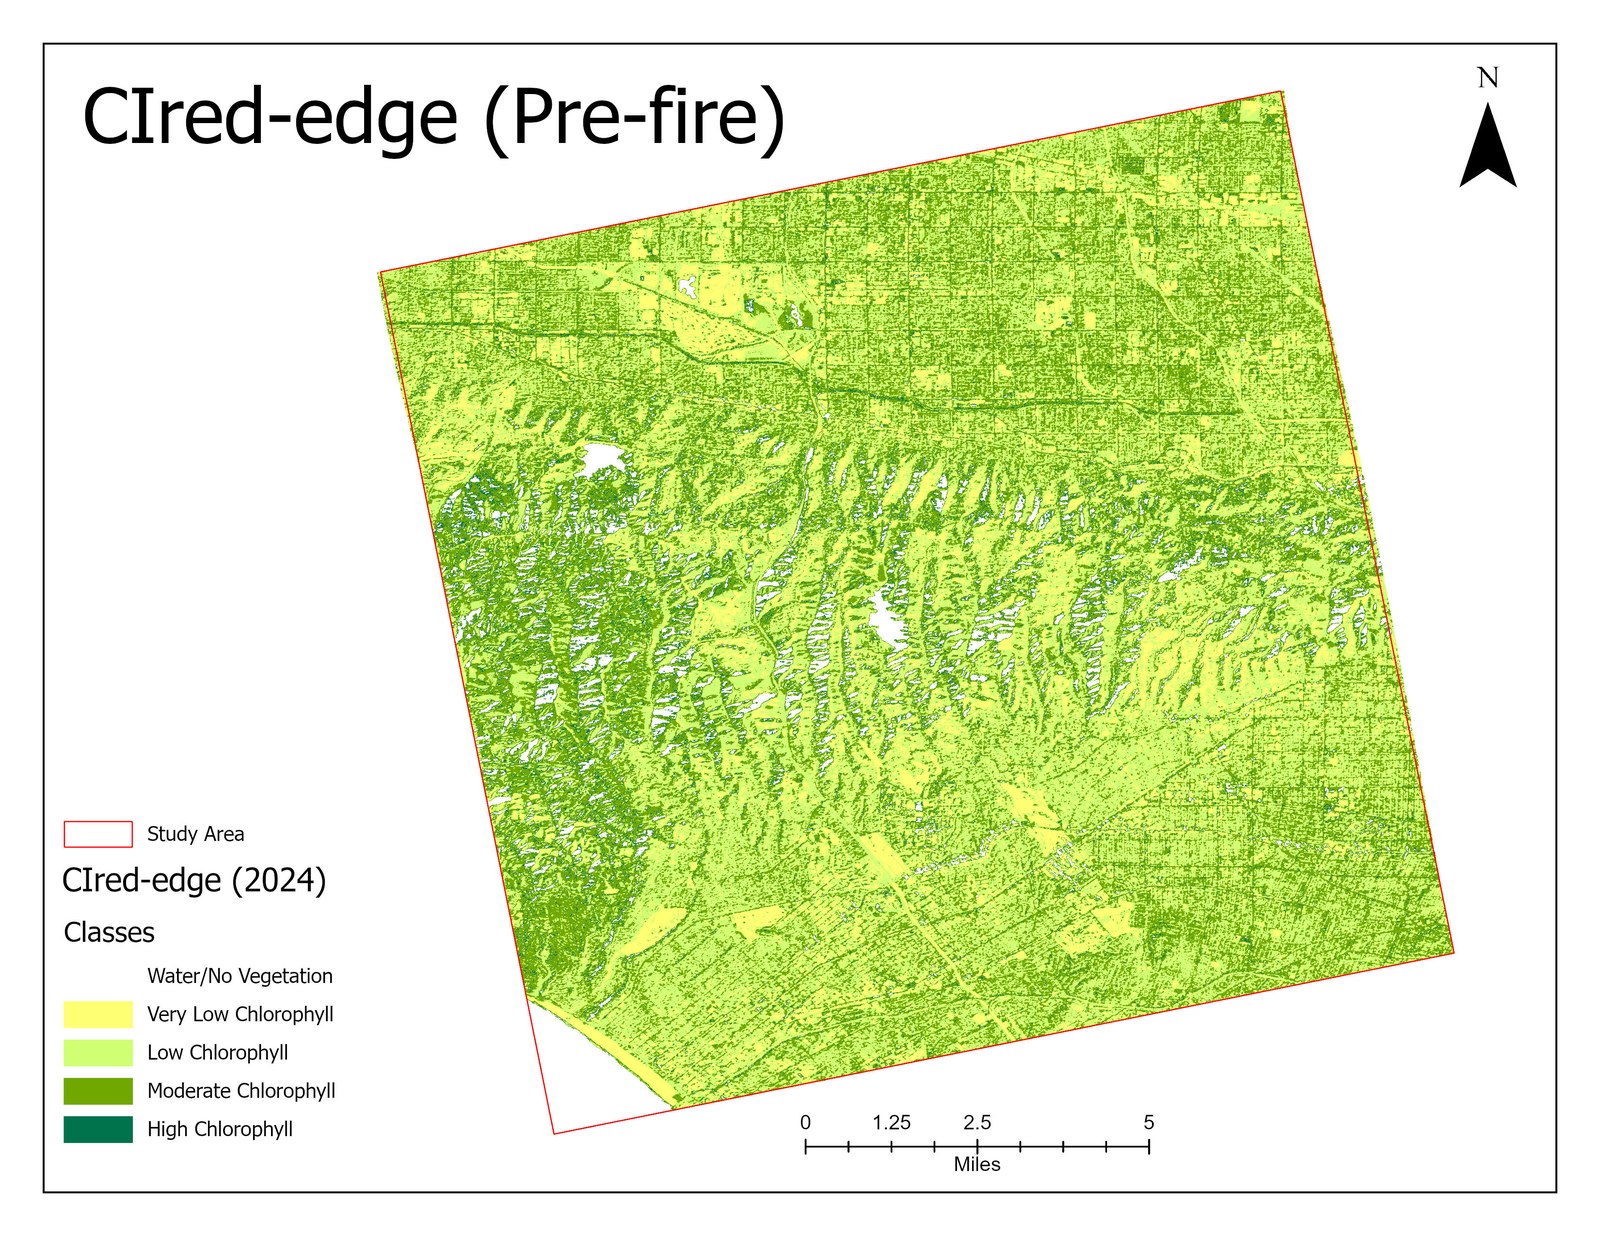
NDVIRED-EDGE · PRE VS POST
- Calibrate severity thresholds against field or dNBR reference data.
- Add atmospheric correction (surface reflectance) for cross-sensor robustness.
- Validate against an independent burn-perimeter dataset.
See the full write-up
Complete README, all maps, and methodology on GitHub.