01The question
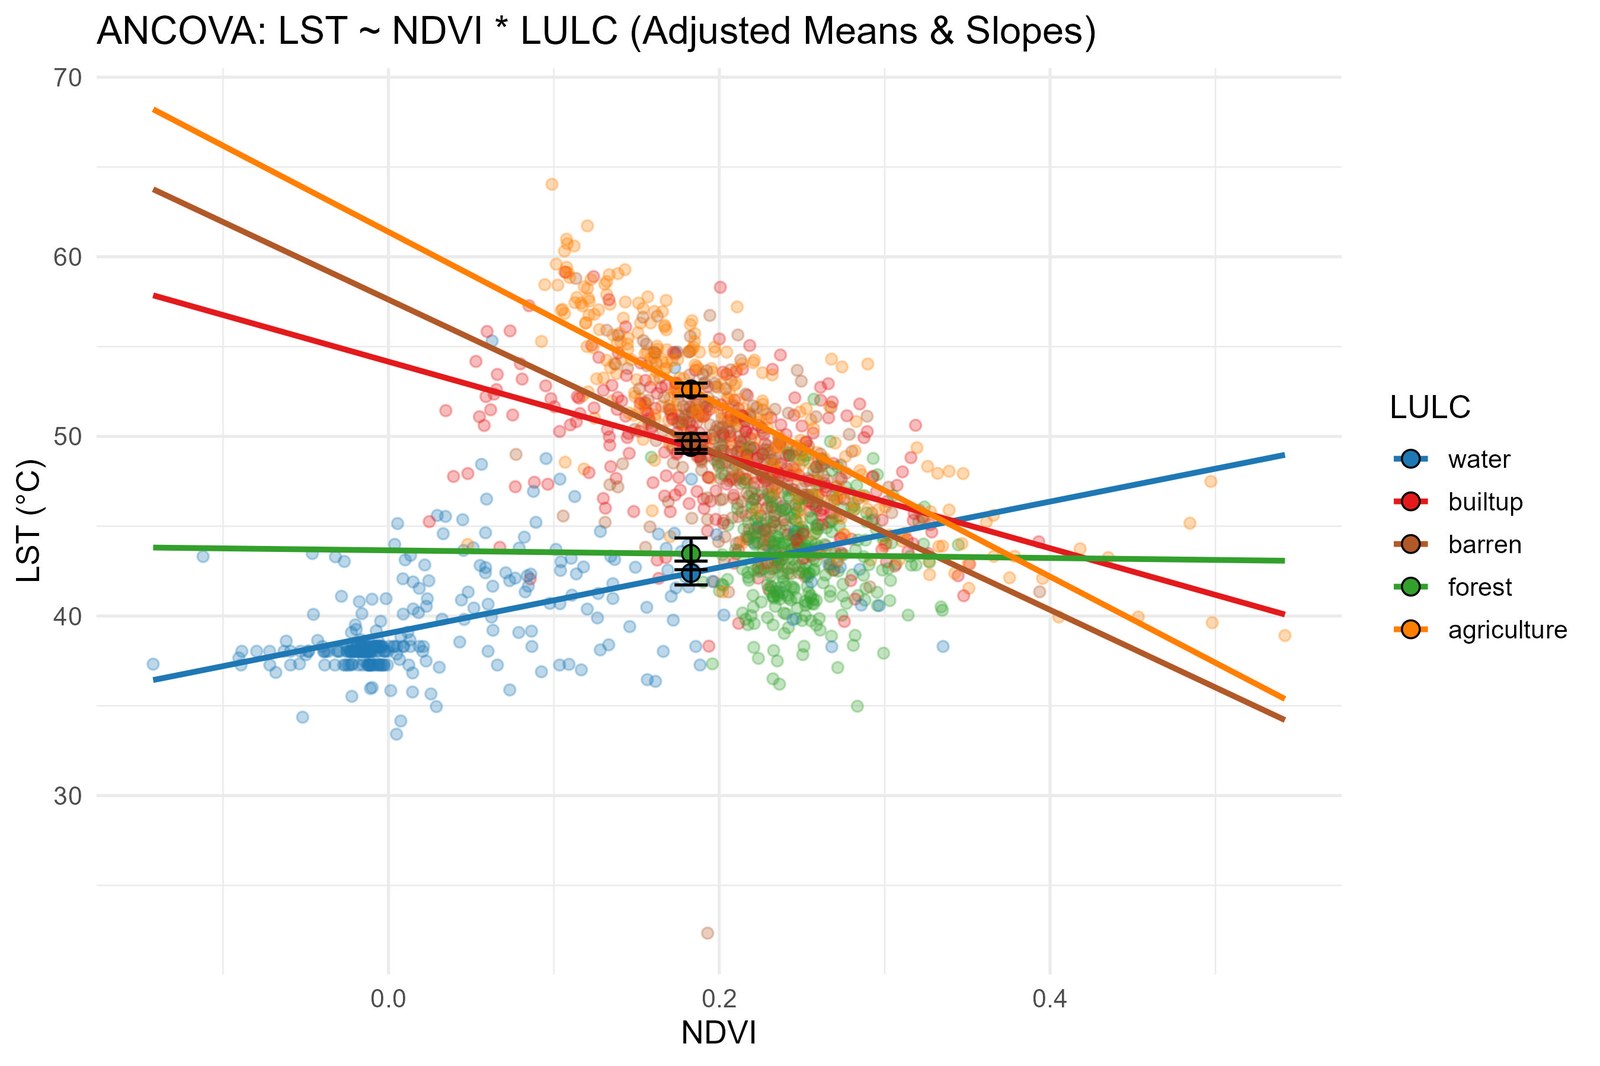
Vegetation cools the surface — but not equally across land types. This study quantifies how the NDVI–temperature relationship varies among water, forest, agriculture, built-up, and barren land.
The interesting result isn't "vegetation cools things" — it's how much that effect changes by land cover, tested with formal statistics.
02Inputs
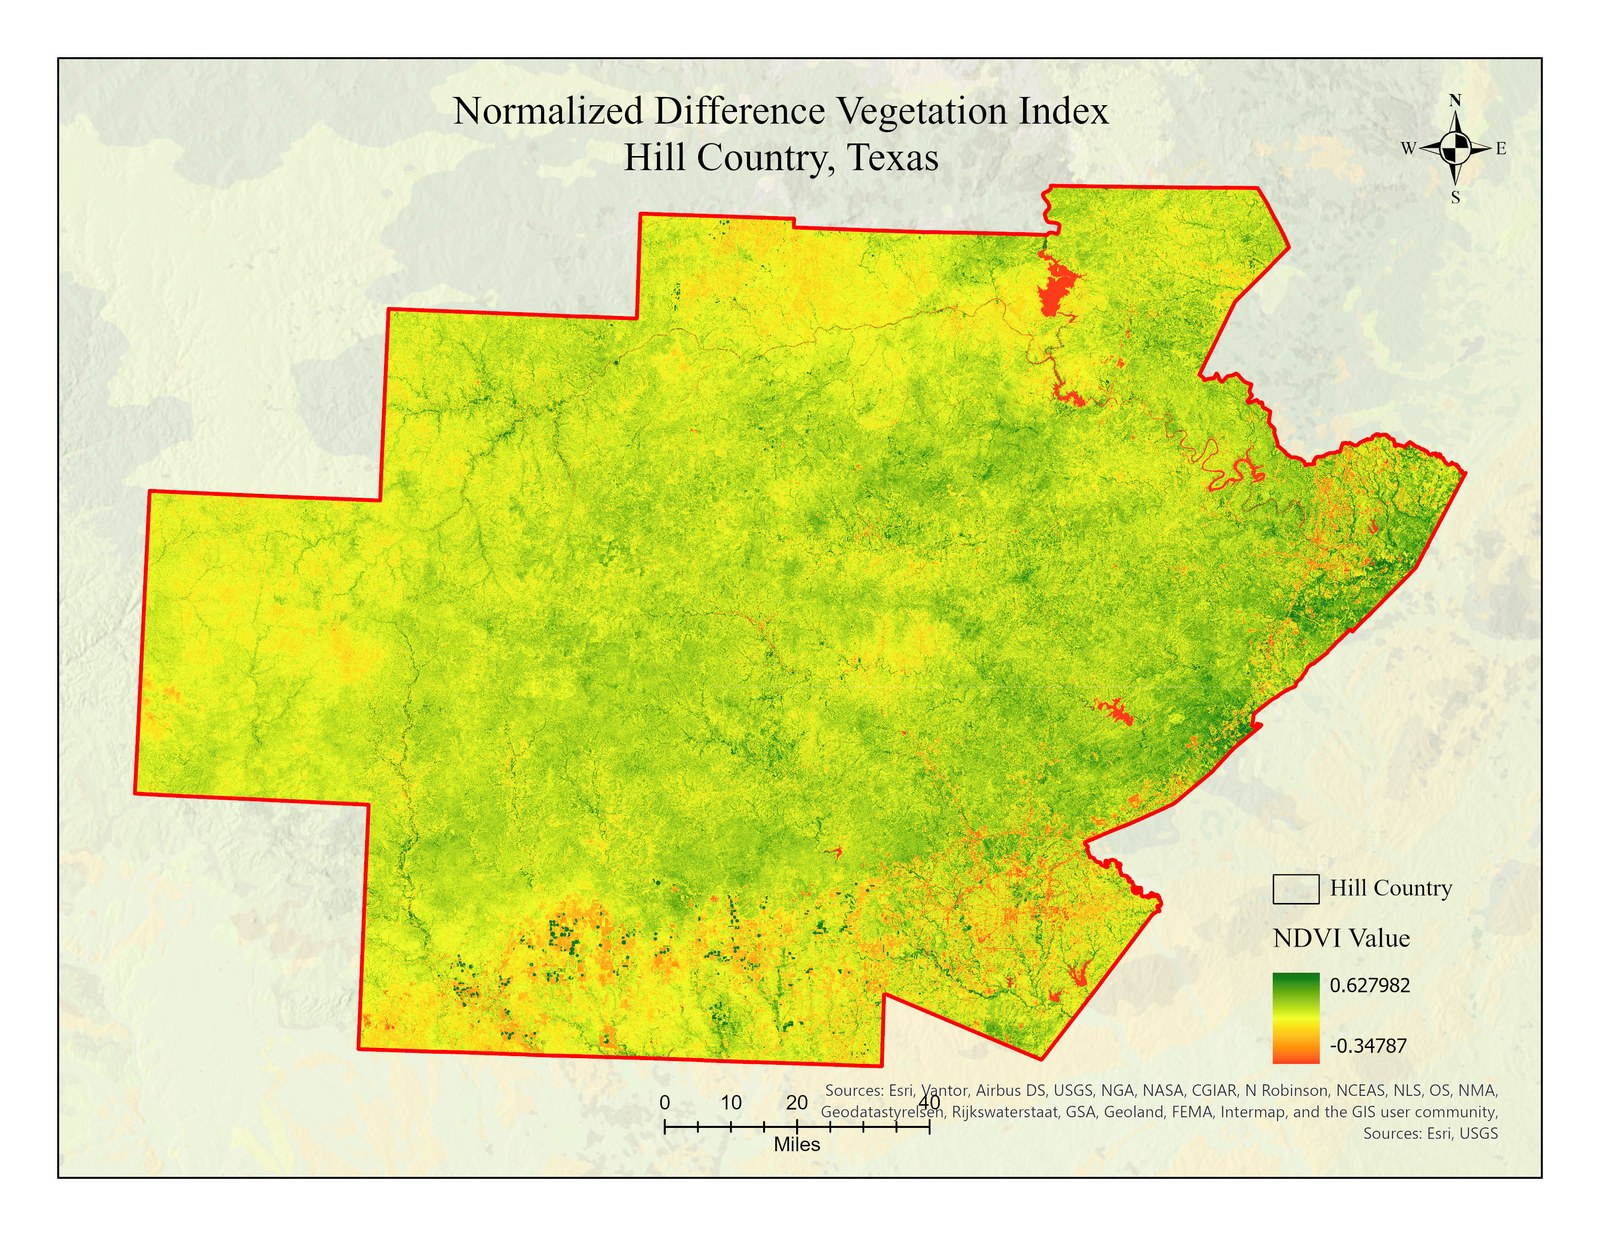
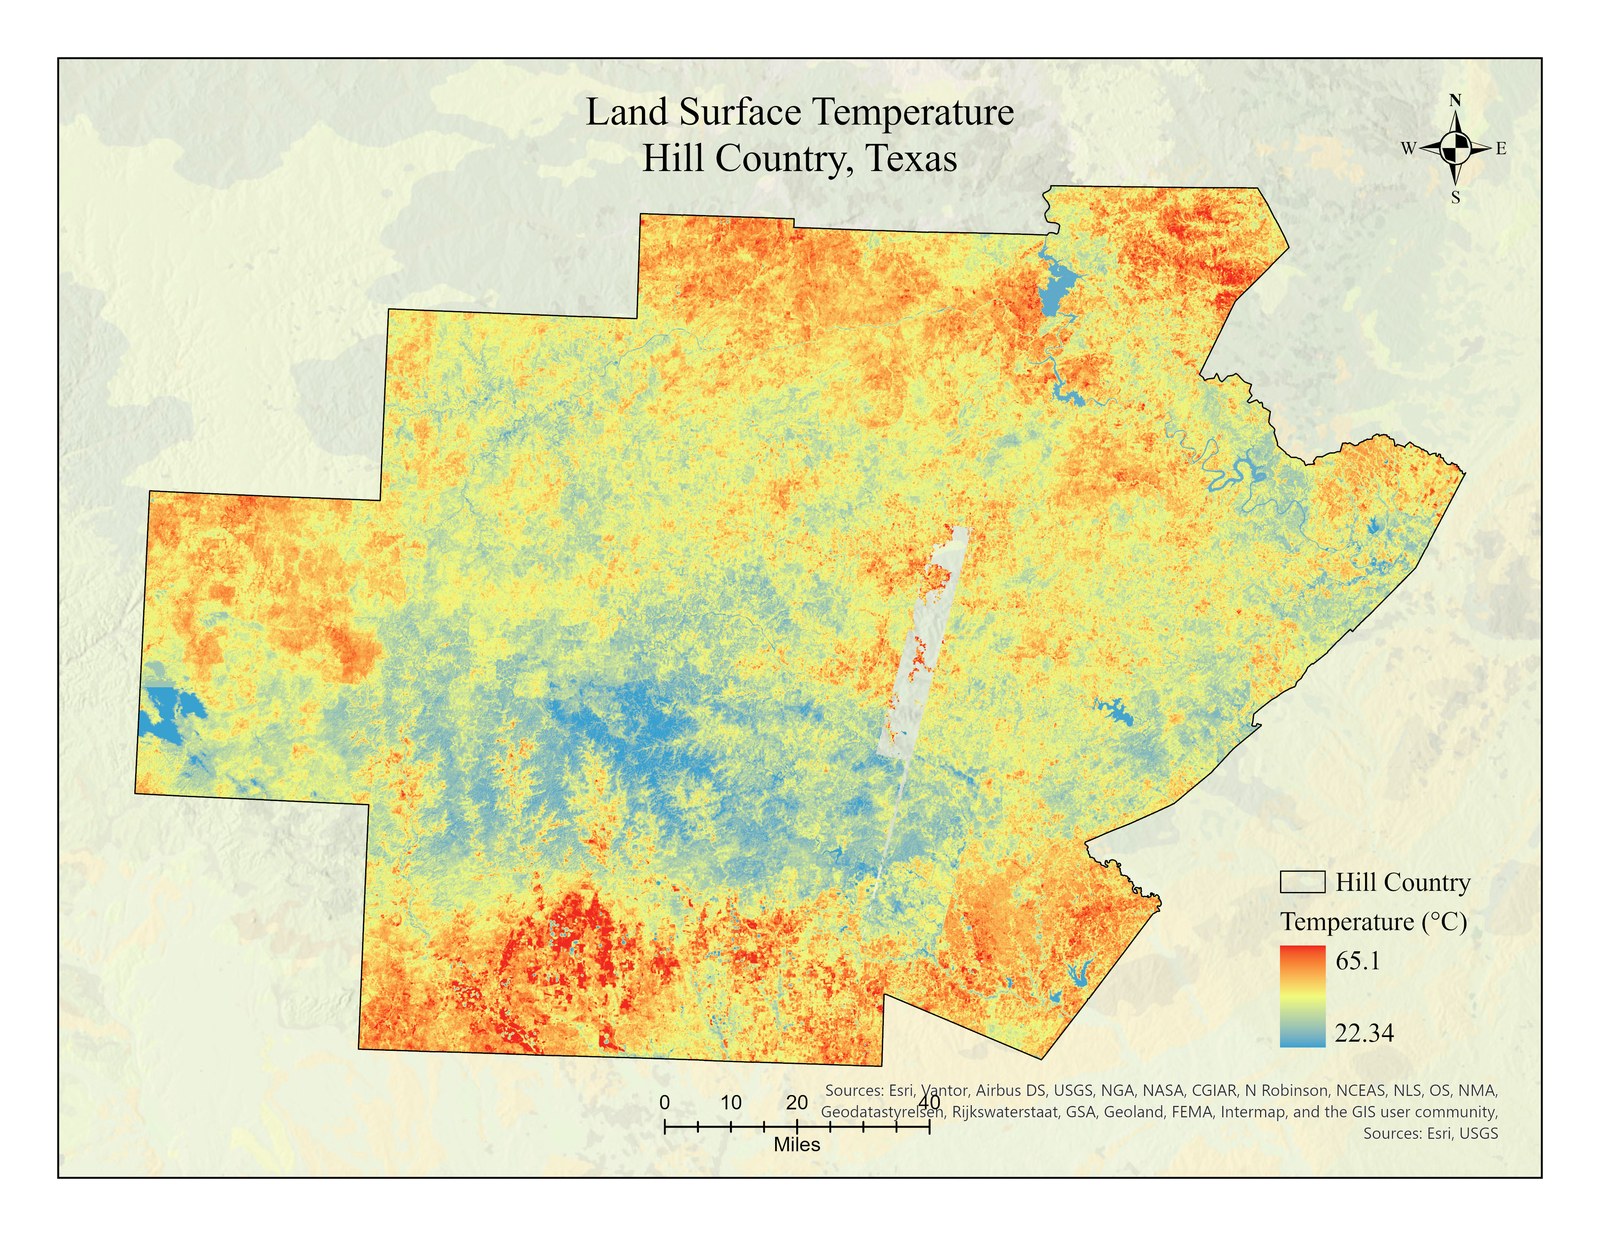
THREE RASTERS · ONE STUDY AREA
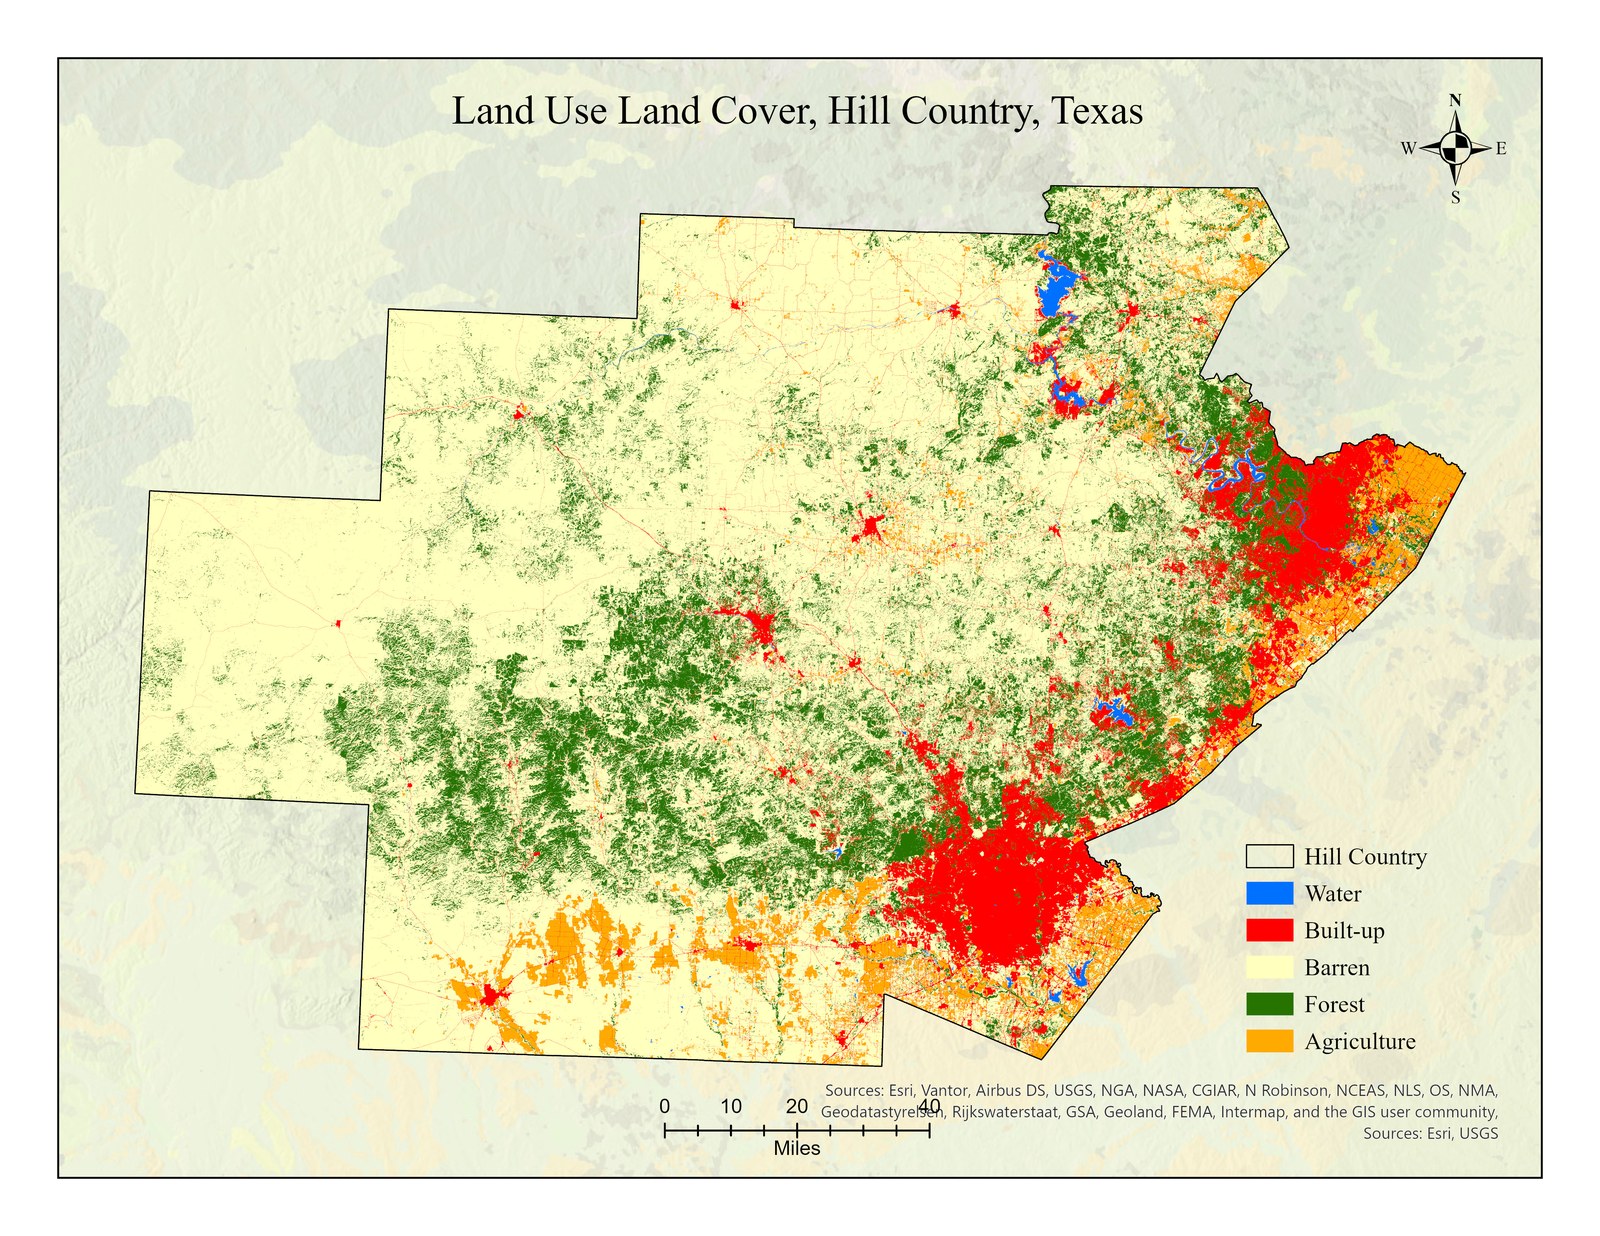
03Method
- Mosaic/stack Landsat bands in ArcGIS Pro; compute NDVI (B5/B4) and LST from thermal band ST_B10 (°C).
- Reclassify NLCD into 5 land-cover classes.
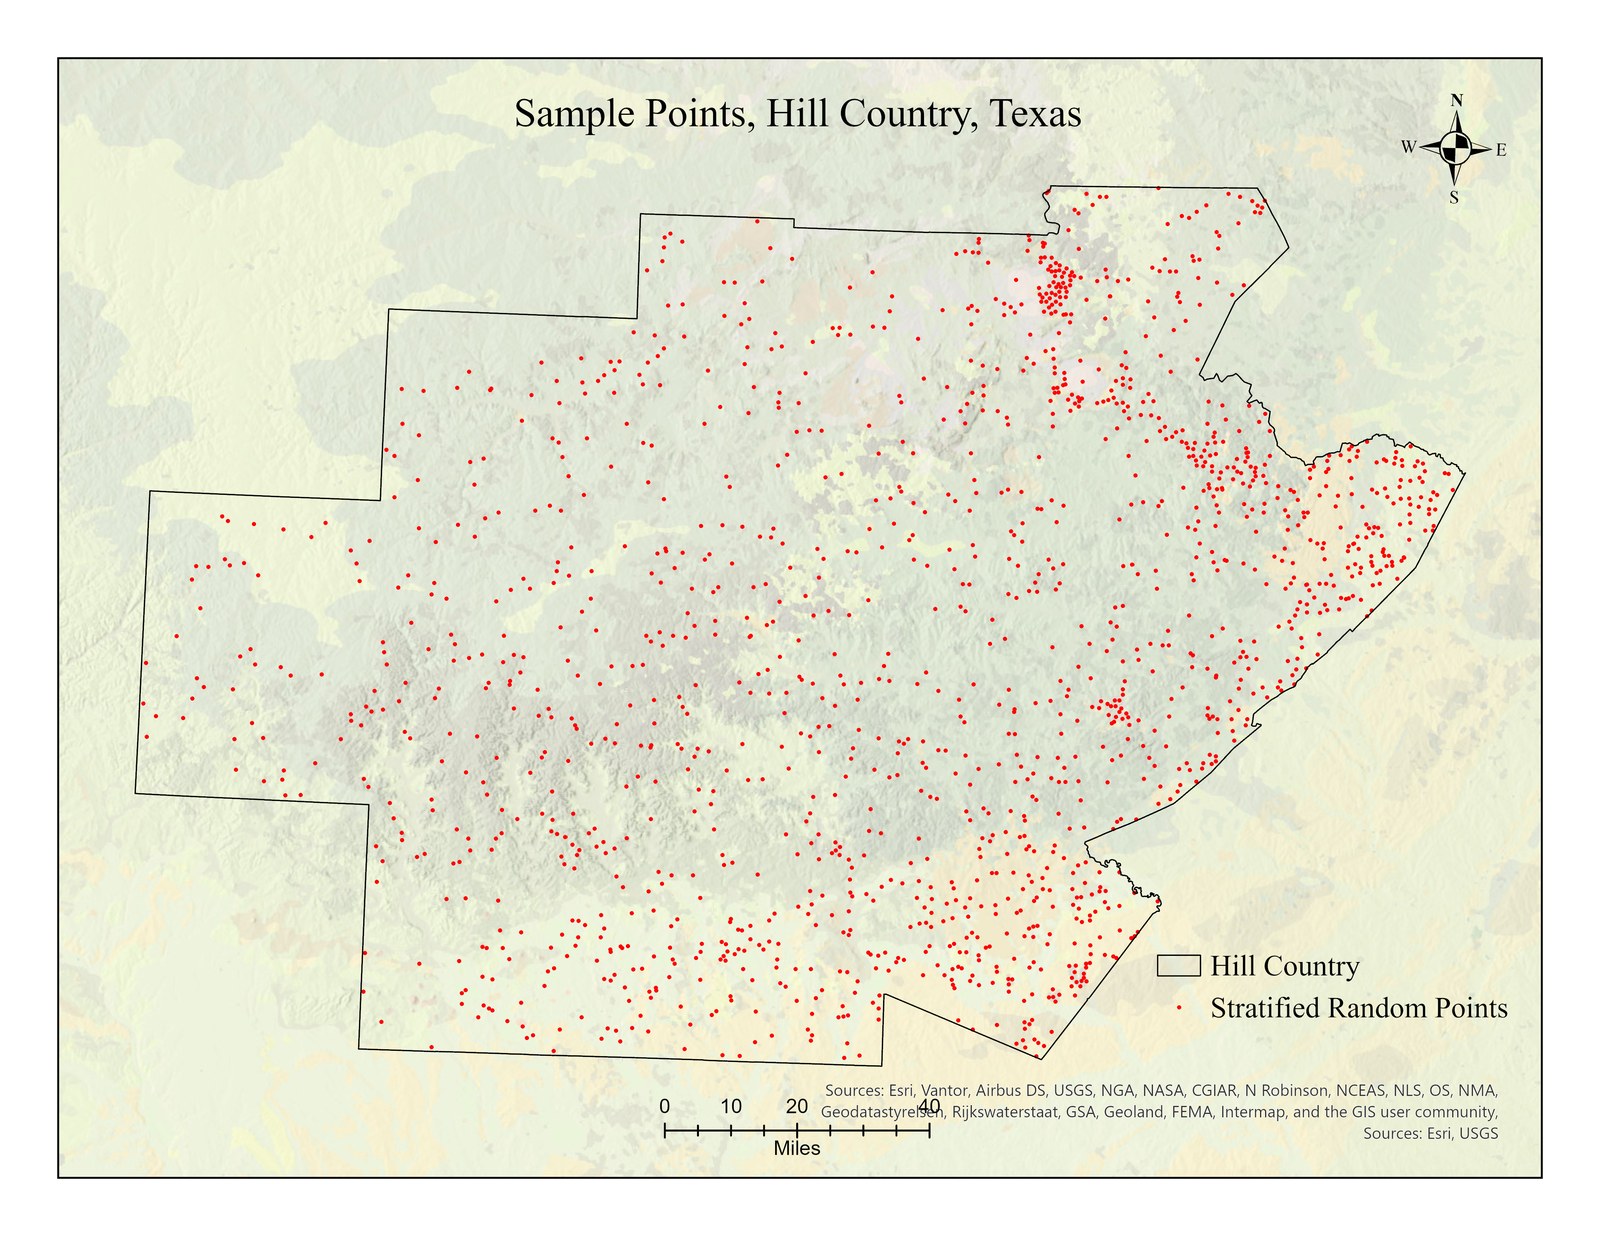
- Stratified random sampling (1,500 points); extract NDVI/LST via Zonal Statistics.
- In R: Levene's test (variances unequal) → Kruskal–Wallis + Dunn post-hoc; Pearson/Spearman correlation; regression; ANCOVA.
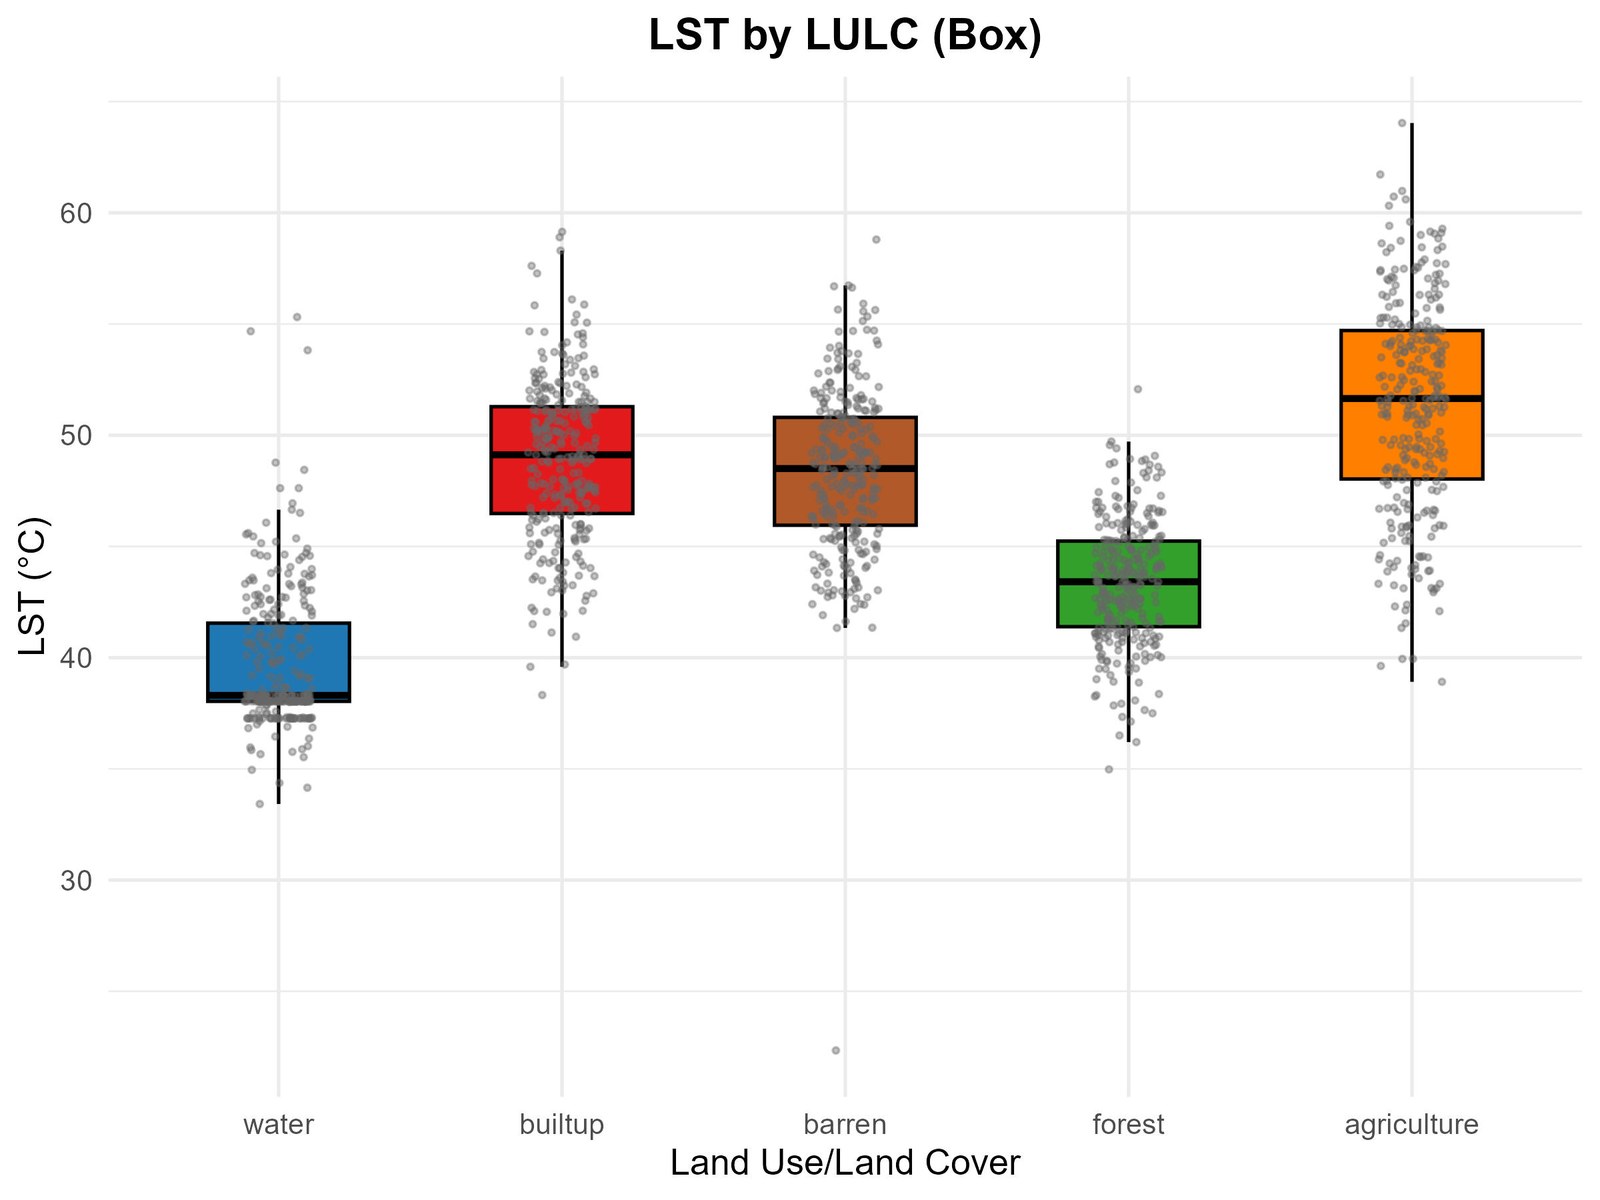
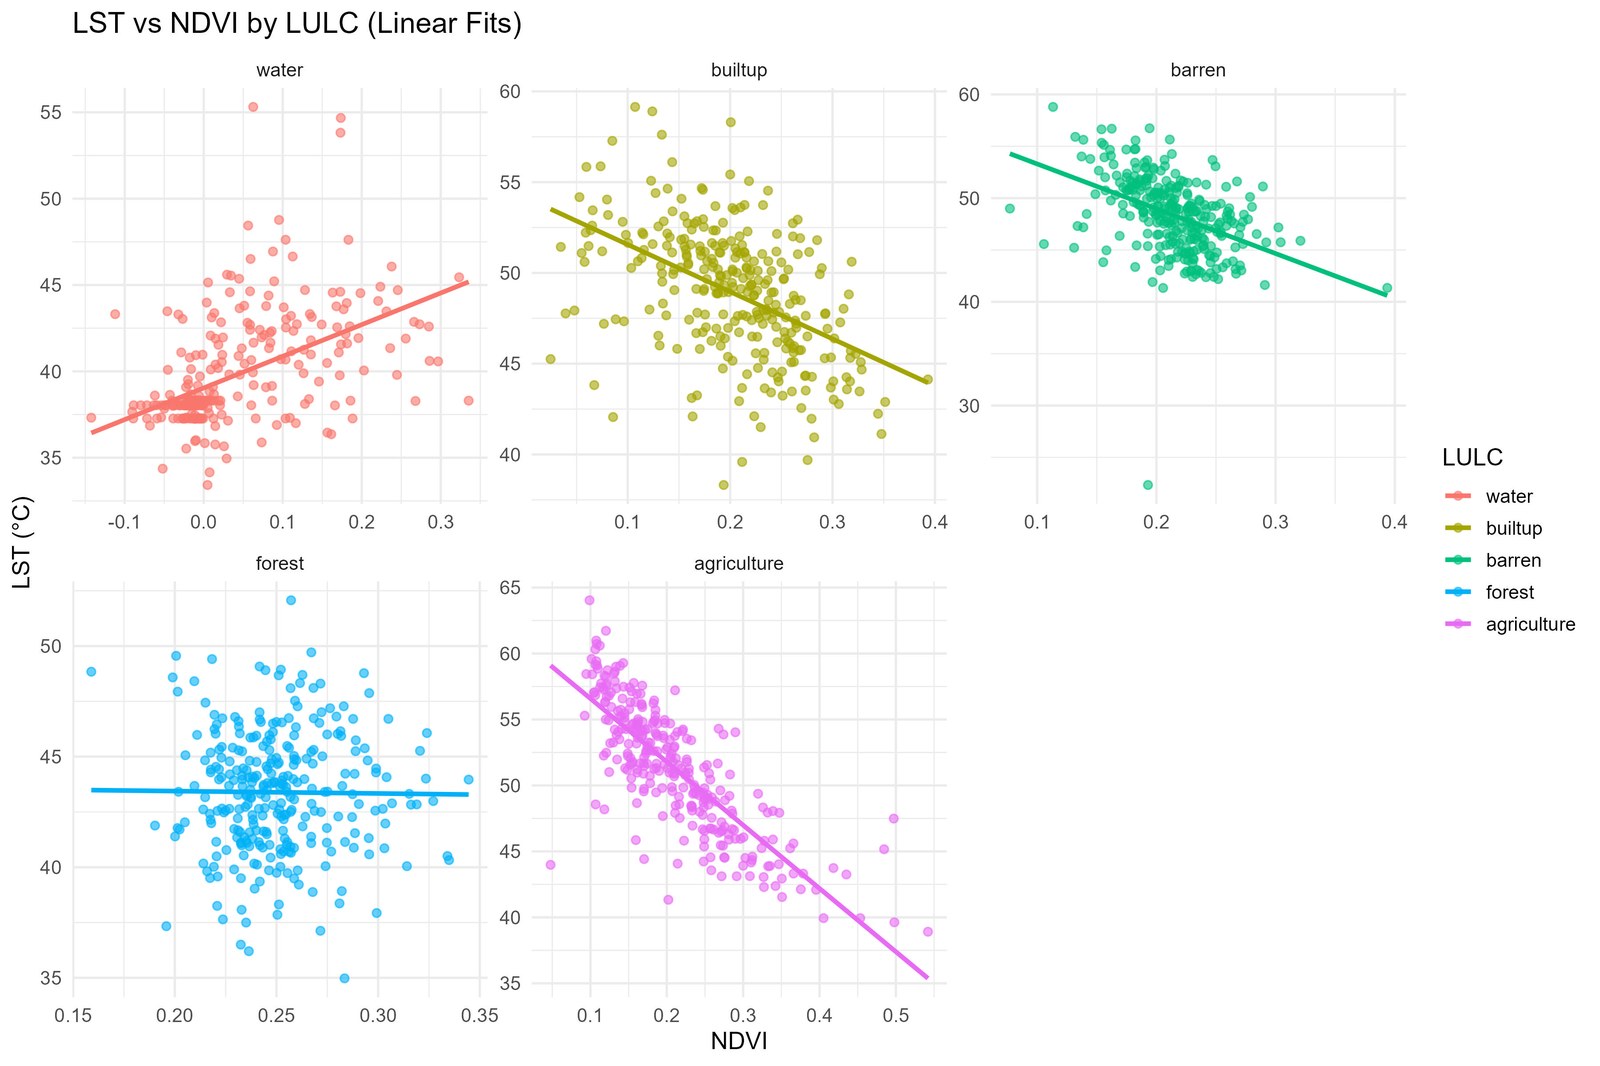
04Results
−0.80NDVI–LST correlation in agriculture
R² 0.64Agriculture regression fit
p < 0.001Classes differ for NDVI & LST
| Land cover | Mean NDVI | Mean LST °C | Pearson r |
|---|---|---|---|
| Water | 0.038 | 39.73 | +0.50 |
| Forest | 0.251 | 43.39 | −0.01 (ns) |
| Agriculture | 0.210 | 51.31 | −0.80 |
| Built-up | 0.203 | 48.89 | −0.48 |
| Barren | 0.214 | 48.36 | −0.43 |
Vegetation strongly cools agriculture, built-up, and barren land, but has almost no effect in forest (already dense, NDVI saturates). ANCOVA confirmed a significant NDVI × land-cover interaction.
05Limitations
- NLCD land cover from a separate source (possible pixel-label mismatch).
- NDVI not meaningful over water; NDVI saturation in dense forest.
- Single-date (Aug 2024) snapshot; 30 m resolution; 5 broad classes.
Read the R code
Full R script, result tables, sample data, and maps on GitHub.